I have a tendency to be pretty verbose in my blog posts. My typical topic length has inched ever higher over time, and I think it's starting to impact my comfort level in starting new topics. Each new post, it feels harder to write about something because of the growing number of things I've discussed, and the growing number of words I seem to use each time. And as readers, I'm sure the sight of a wall of text is none too enticing.
This week, I had an idea for something different: fake graphs about real things. Basically, there are some concepts in game development that seem like they are easily described in graphs. They're not always possible to quantify, but the trends are pretty easy to qualify. Like describing volume as a function of distance from a speaker, or speed as a function of time spent accelerating, we can describe certain things in our industry in relation to other values.
So, before I accidentally type another paragraph, let's start "graphing!"
 |
| Fig. 1: Amount of time spent actually working on game over length of project. |
The above one's pretty easy. Particularly if you're a solo indie, this is what you should plan for. In fact, it's a bit incomplete:
 |
| Fig 1a: Everything else you'll be doing. |
Oh, and one more thing:
 |
| Fig 1b: It ain't over 'til it's over. |
Here's another one for those running a game-as-a-service or Minecraft-like beta funding model:
 |
| Fig 2: Anxiety as a function of build release schedule. |
Those with heart conditions shouldn't wait too long between releases! Particularly if:
 |
| Fig 2a: Ohgodohgodohgodohgod! |
This one, while sobering, is probably no surprise to most:
 |
| Fig 3: Game sales over time. |
"That's not so bad," you might think. But we may be missing some points of reference:
 |
| Fig 3a: WTB rent-free treehouse with free electricity and internet... |
There are a few things you can do to help, though:
 |
| Fig 3b: Or this might just be a NASA pulsar graph |
Each of these peaks will likely have a diminishing effect on the subsequent peaks, as market saturates and relevance decreases over time.
You could also try adjusting the price of your game:
 |
| Fig 4: Sales as a function of price. |
$0 is a popular price! Conversely, not many people are into mortgaging their homes to buy a game. Though, as the app store has shown us, there are 8
people who will buy your game no matter what (1 of which, accidentally).
How does this look in terms of actual money? Probably something like this:
 |
| Fig 4a: Number may not actually be magic. |
This assumes some minimum price, of course. Most places aren't selling games for $0.000001. If that were the case, the vertical slopes would be more gradual.
Let's talk about another topic. Phil Fish has recently made the
news (again), and you might be wondering what you'd do in his shoes. Being criticized can be unpleasant, but not all criticism is created equal:
 |
| Fig 5: Amount of attention paid to criticism vs. how much I respect the critic. |
Put another way, if someone is the type of person who slings insults at complete strangers over the internet, it's hard to take them seriously. After all, with such a low barrier to lashing out, they probably do it to everyone. I might even feel left out if they
didn't.
Similarly:
 |
| Fig 5a: Attention paid as a function of bias. |
Overly negative (and positive!) commentary isn't very useful, so I tend to pay the most attention to balanced critique and critics. Overly biased feedback is about as helpful as a ruler with all 8s.
Speaking of usefulness:
 |
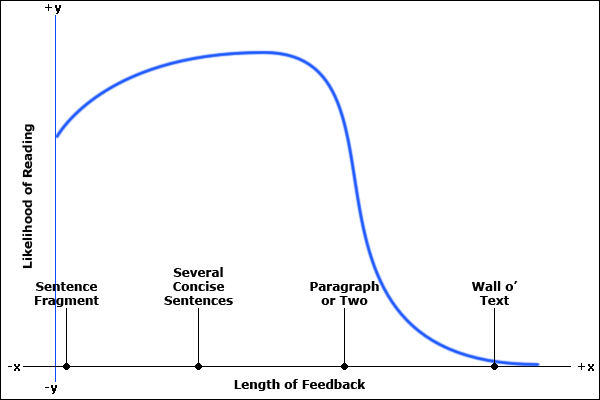
| Fig 6: Likelihood of reading feedback as a function of its length. |
If I open up an email or forum thread, this is pretty much how things are going to play out. Don't get me wrong, the following is also true:
 |
| Fig 6a: Wanting and doing are different things, though. |
But if it's going to take me 30 minutes to read, 15 minutes to digest, another 10 to re-skim, and then an hour to reply...well, I might not. Of course, I tend to dwell in the far right hand side of this graph when writing, so there's some irony/hypocrisy to be had here.
And while we're on the topic of weaknesses, here's a big one for me:
 |
| Fig 7: Desire to postpone decision as a function of its importance. |
Decisions can be hard. Big decisions even more so. While it can be healthy to take time to consider options when faced with a decision, it can be unhealthy to postpone for too long:
 |
| Fig 7a: "Just a little more research..." |
The important feature of this graph is the peak and subsequent negative slope. For every decision, there is some amount of consideration that is optimal, and beyond that, an ever-increasing opportunity cost. The real-world version of this graph may be bumpy, but the general form is the same.
There are more, of course, but this is already quite a bit. Let me know if you found this format to be helpful, entertaining, or even erroneous. And enjoy the break from my walls o' text while you can!